

Bifurcated oil market

Most people scrutinize charts to validate an outlook they are deeply convinced about. On the contrary, we tend to look for clues that might challenge our views.
We've been bearish crude oil since 2022. Despite the uproar from the oil bros (or perhaps because of it), this has proven to be the right call so far. Nevertheless, we have recently identified a trend that defies this stance.

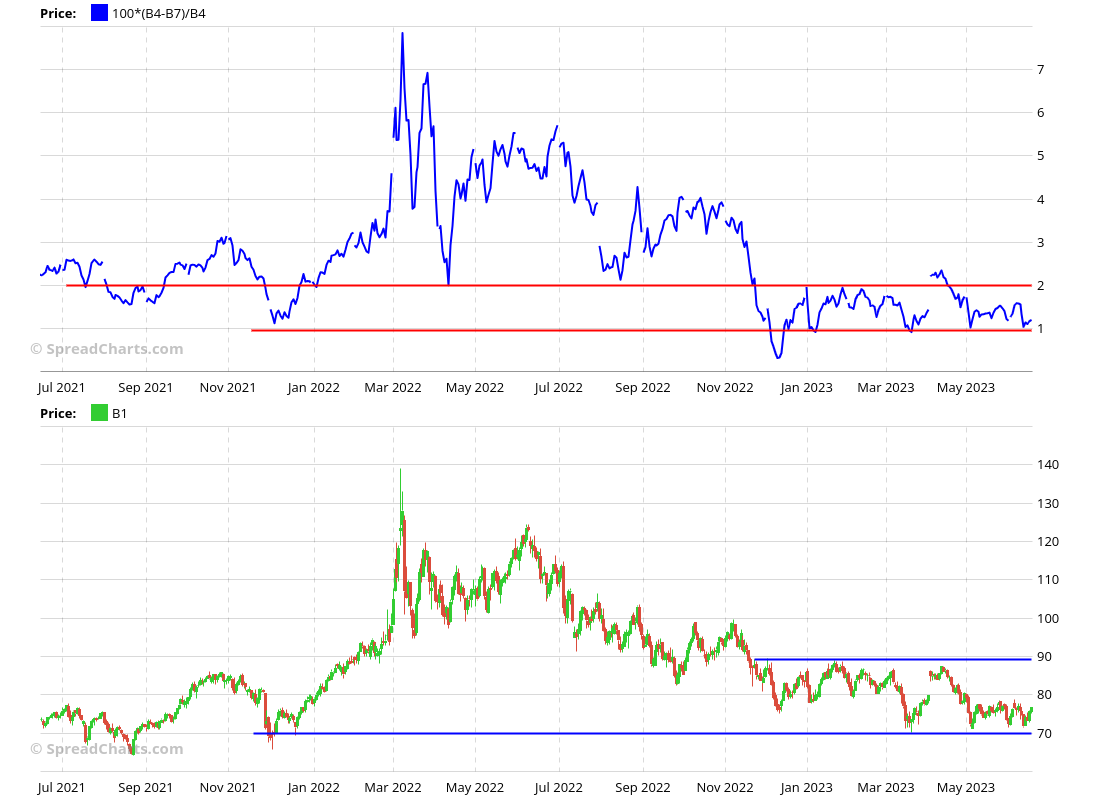
Above is the 3-2-1 crack spread that reflects the refinery margins in the USA. Naturally, strengthening margins highlight robust demand for products like gasoline or fuel oil. It is usually just a matter of time until this strong demand for products translates into increased demand for crude oil and consequently, higher prices.
The recent surge in the crack spread cannot be ignored any longer. Upon closer examination, both gasoline and diesel have been strong. It's especially surprising for diesel, as you can see on the ULSD spreads' chart below. Diesel is more sensitive to industrial demand and better reflects the health of the economy. That doesn't fit the recession narrative, right?
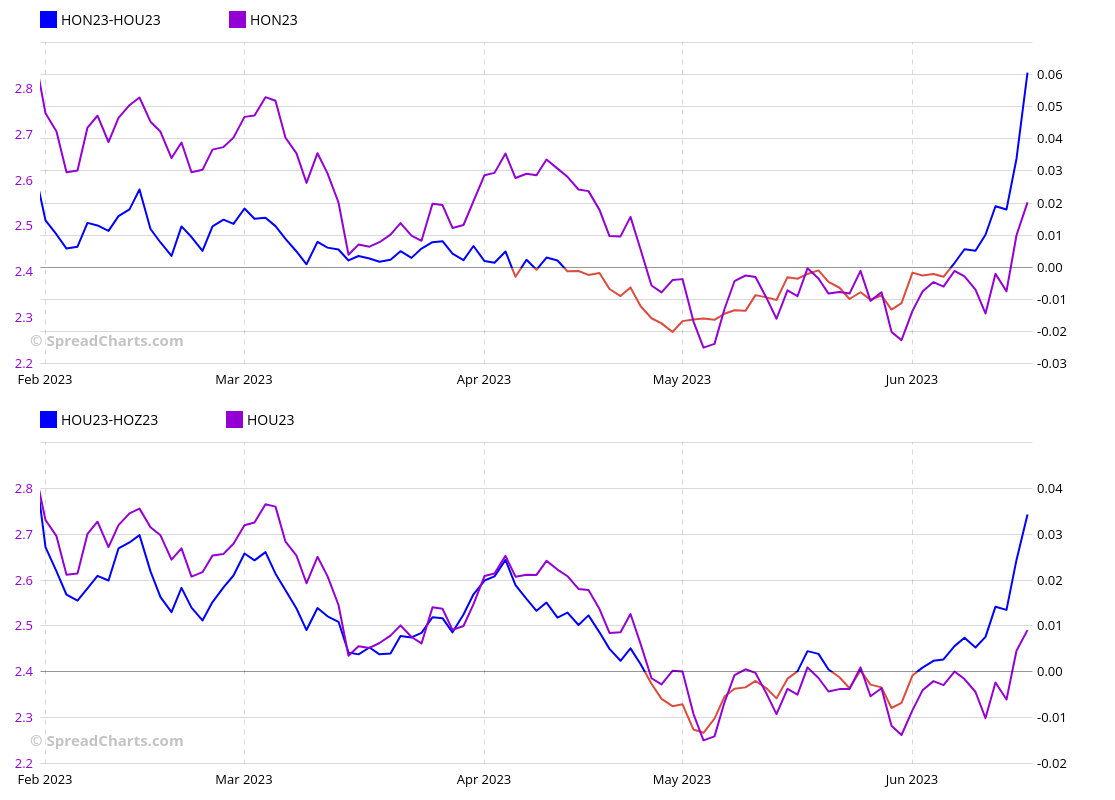
What is even more surprising is that this strength in diesel is not confined to the USA alone. The interdelivery spreads for European Gasoil shown below exhibit a similar trend.

Apparently, this was not unpredictable at all. Users of the premium version of SpreadCharts were alerted in advance by this signal on gasoil bull spread generated by our AI model.

And while these countertrend opportunities are risky, they can be profitable.

So, how can we reconcile this product strength with our general outlook for crude oil? Fortunately, relying on data instead of opinions greatly simplifies this task for us. While the improvement in the cracks is notable, it isn't sufficient to completely change our outlook, at least not yet.
The positioning is far from a major washout. And as we explained in May, the market structure is not convincing either. We have the following chart of Brent backwardation in mind.
The backwardation in the mid-part of the curve remains stuck within the neutral zone between 1% and 2%. No sign of strength there. We need to see more evidence to become convinced that the decline in crude oil prices is over.
If you enjoyed the article, please click the like button at the bottom. Thank you!
Disclaimer
All information in this post is for educational purposes only and is not intended to provide financial advice. If any financial instruments, strategies, securities, or derivatives are mentioned anywhere in this post, it is solely for educational purposes.
SpreadCharts s.r.o., its affiliates, and/or their respective officers, directors, and employees may from time to time acquire, hold, or sell securities mentioned here.
SpreadCharts s.r.o. and its representatives bear no responsibility for actions taken under the influence of information published anywhere in this post and linked resources. There is a risk of substantial loss in trading futures, options, stocks, ETFs, or other financial instruments.