Anyone following the markets is aware of the current gold price in US Dollars. However, gold trading is not limited exclusively to the US. Gold products, primarily in the form of jewelry, are purchased by people all around the world. For these individuals, the price of gold in their local currency is what matters most.
And why should Americans care about this? The answer lies in the fact that gold consumption in India and China is significantly higher compared to the US. If Indians and Chinese stop buying, the gold price will inevitably move, even in US Dollars.
Today, we want to draw your attention to an interesting development. We will examine 5-year charts of gold priced in four major global currencies: the European Euro, Japanese Yen, Indian Rupee, and Chinese Yuan.
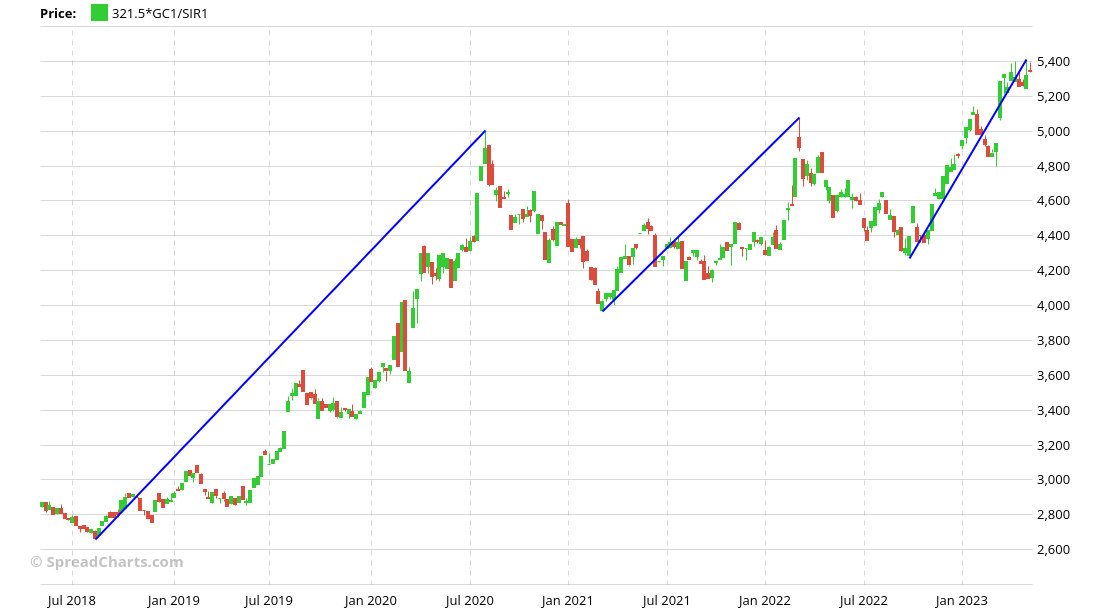
First, we consider the price of gold in EUR per kilogram. Two points are worth noting: first, the price has stalled at €50k, a significant resistance. Second, gold is losing momentum, as evidenced by the decreasing size of the upswings. We've used blue lines to illustrate this, connecting previous local lows to subsequent highs. Clearly, the lines are becoming shorter.
When a market begins losing momentum, it's usually only a matter of time before a correction occurs. But usually does not mean always. Sometimes, the price consolidates in a sideways move and regains momentum soon after. The €50k level is a significant psychological support and will likely be tested in the event of a correction.
Next, we examine the price of gold in JPY per gram. Similar to the Euro, we can see a loss of momentum here as well. The key level to watch is ¥8000. A sustainable break below it would render the entire trip above it a false breakout.
The price of gold in Rupees looks somewhat more encouraging than in Yen. It is not so overextended to the upside and has managed to surpass the crucial ₹5000 per gram level. However, just like in the case of Yen, this support must be held for the uptrend to continue.
Lastly, we look at gold in Chinese Yuan. Of the four charts, this one looks the most promising. There is no loss of momentum, and the consolidation appears bullish. If gold has a chance to outperform, it will likely be against the Yuan. This aligns perfectly with our bearish outlook for the Chinese currency.
What conclusions can we draw from these charts? Although strength often leads to more strength, the loss of momentum against some major currencies is a concerning sign. Furthermore, consider whether Indians and Chinese, traditionally heavy buyers of physical gold, will be willing to buy at these elevated prices. Yes, gold is in a long-term uptrend in both Rupees and Yuan, but consumers usually need time to adjust to new, higher prices.
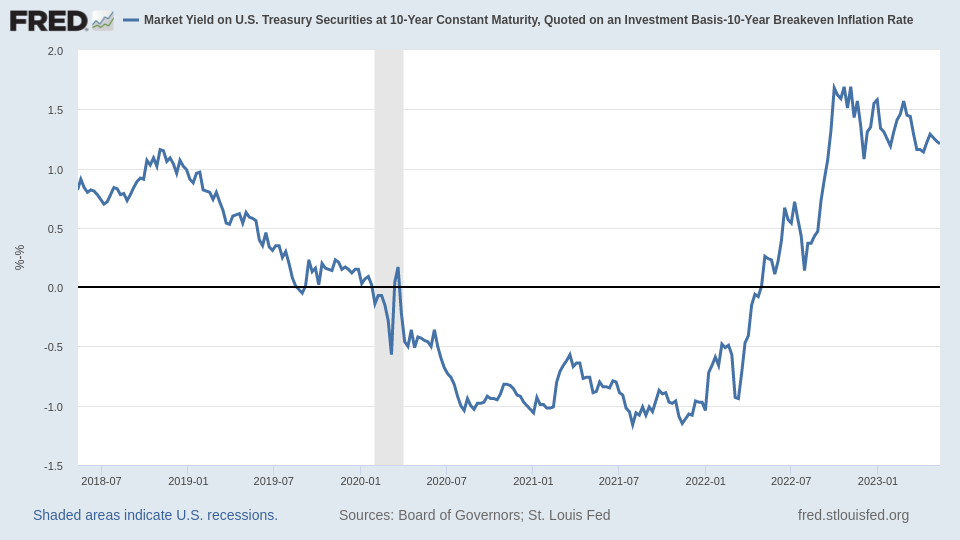
So, what will determine the fate of gold in the short to medium term? In our opinion, it will be this chart.
Premium users of SpreadCharts are well familiar with it, as we've emphasized its importance in our quarterly macro outlooks. However, a new dynamic is about to shape this chart.
What will it be, and how will it impact gold? We will answer this question in the upcoming video analysis later this week. If you want to watch it, make sure to subscribe to the premium version of SpreadCharts.
If you enjoyed the article, please click the like button at the bottom. Thank you!
Disclaimer
All information in this post is for educational purposes only and is not intended to provide financial advice. If any financial instruments, strategies, securities, or derivatives are mentioned anywhere in this post, it is solely for educational purposes.
SpreadCharts s.r.o., its affiliates, and/or their respective officers, directors, and employees may from time to time acquire, hold, or sell securities mentioned here.
SpreadCharts s.r.o. and its representatives bear no responsibility for actions taken under the influence of information published anywhere in this post and linked resources. There is a risk of substantial loss in trading futures, options, stocks, ETFs, or other financial instruments.


