We warned you three weeks ago that liquidity was waning. However, it's important to remember that while bottoms in the stock market are an event, tops are a process.
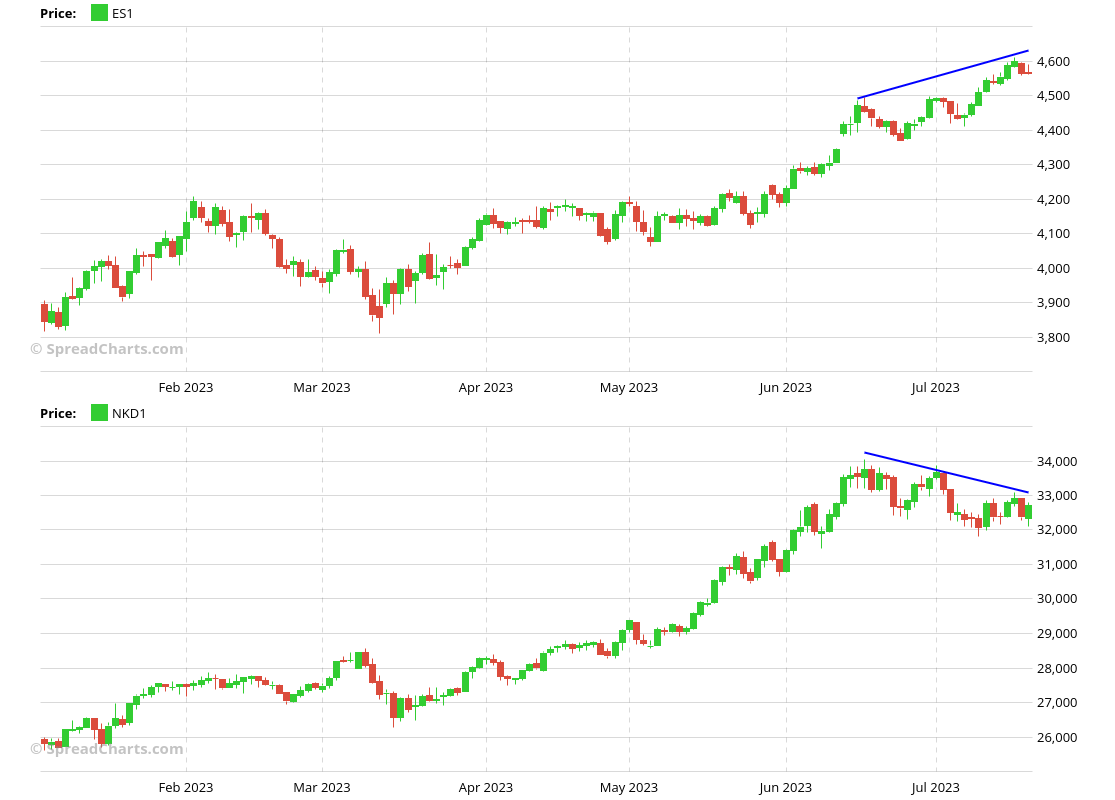
That being said, the divergences are starting to pile up, and it would be wise to pay attention to them.
We can all agree that the stock market is short-term overbought. If you prefer a quantitative perspective, consider the percentage of SPX stocks above their 50-day MA. We're approaching the 90% level which marked the previous two local tops.
Although I stated that overbought conditions can persist for some time, we're just past the VIX futures expiration, and funny things can occur around this time, as we explained in an earlier article.
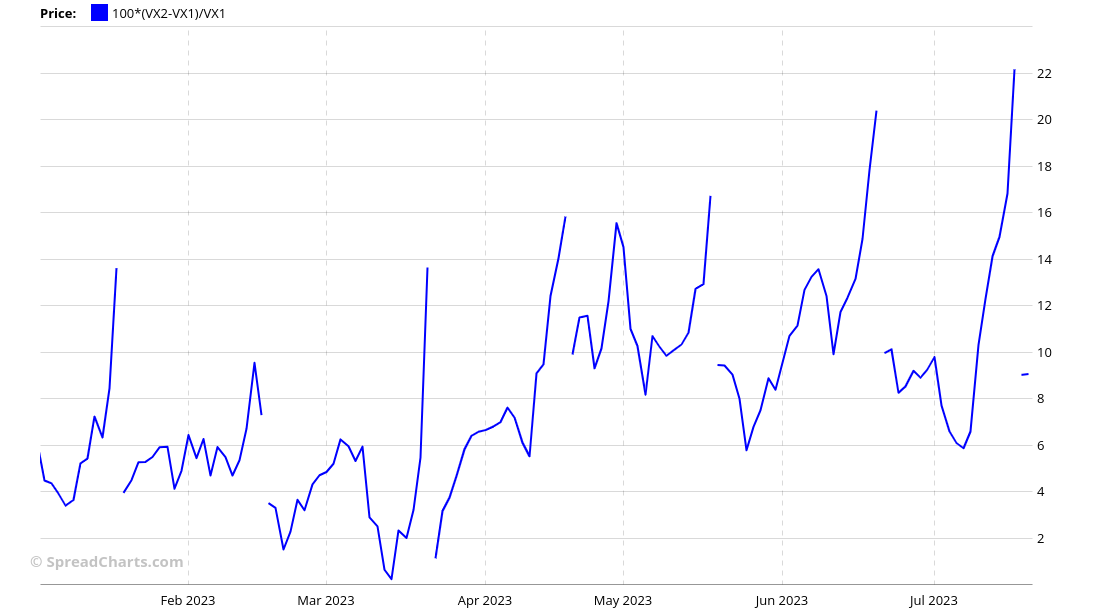
This VIX expiration certainly wasn't bland, as we witnessed another massive contango spike to 22% on the front end of the curve.
Ok, but where are the divergences? Let's start with the Nikkei. Many major corrections over the past five years originated in Asia, and the next one might not be any different.
Let's return to volatility. As we alerted you on Twitter earlier this week, the VXEEM volatility index, representing emerging markets, has been on the rise, while the US VIX remains subdued.
Lastly, the most important of all, consider the VIX contango on the middle part of the curve compared to S&P 500 futures. Notice the current divergence. A similar divergence earlier this year led to a drop in the S&P 500 from 4200 to 3800.
So, are stocks about to sell off immediately? Perhaps. As we explained above, it can take some time to play out. But reducing exposure or hedging right now would certainly be wise.
Remember this post is all about short-term action. We’re actually more interested in the medium-term horizon that we outlined in our Quarterly macro outlook for premium users of SpreadCharts at the beginning of July. The way in which data evolves during the upcoming correction will be key to the strategy we described there.
If you enjoyed the article, please click the like button at the bottom. Thank you!
Disclaimer
All information in this post is for educational purposes only and is not intended to provide financial advice. If any financial instruments, strategies, securities, or derivatives are mentioned anywhere in this post, it is solely for educational purposes.
SpreadCharts s.r.o., its affiliates, and/or their respective officers, directors, and employees may from time to time acquire, hold, or sell securities mentioned here.
SpreadCharts s.r.o. and its representatives bear no responsibility for actions taken under the influence of information published anywhere in this post and linked resources. There is a risk of substantial loss in trading futures, options, stocks, ETFs, or other financial instruments.


